Technical analysis
Trendlines and Channels: Analyzing Market Direction
Trendlines and channels are fundamental tools of technical analysis that allow you to clearly understand the direction of the market and the strength of price movements. Used correctly, these guidelines…
Trendlines and channels are fundamental tools of technical analysis that allow us to clearly understand the direction of the market and the strength of price movements. Used correctly, these guidelines help traders visualize trends, identify reversal points and plan more informed trades.
In the world of cryptocurrencies, where volatility is often high, trendlines and channels become even more valuable for deciphering market behavior.
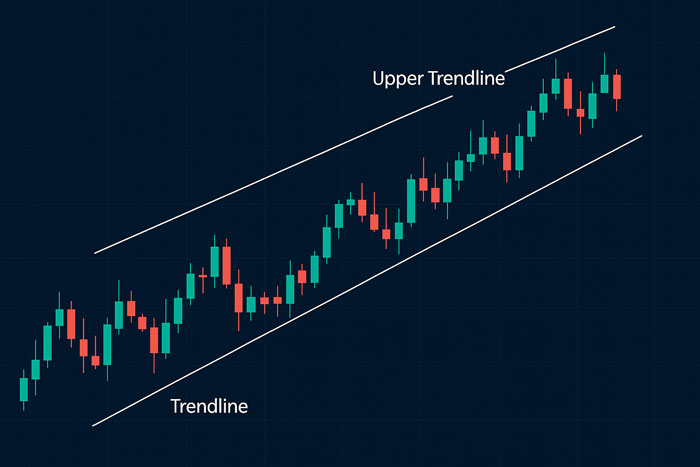
The trendline is a straight line drawn on the chart that connects a series of increasing lows in an uptrend or decreasing highs in a downtrend. Its function is to highlight the dominant direction of the market and act as a psychological guide for traders. A well-drawn trendline shows where the price tends to bounce during a directional move, offering strategic entry opportunities.
The more times the price touches the trendline without violating it, the stronger the trend and the greater its reliability. On the contrary, a sharp break of the trendline can signal a weakening of the movement and a possible change in direction.
The channels represent the natural evolution of trendlines. A channel is formed by drawing a second line parallel to the main trendline, positioned on the other side of the movement. In bullish channels, the upper line acts as dynamic resistance, while the lower line is dynamic support. In bearish channels, the opposite happens.
Channels allow you to accurately view the magnitude of the price movement and predict areas where the market may react. They offer a more complete picture than a simple trendline, helping traders locate buy and sell points with greater accuracy.
These tools are also particularly useful for recognizing breakouts and false breaks. A breakout above the channel in an uptrend can indicate market acceleration, while a breakout down could signal a loss of strength. Distinguishing between a real move and a false breakout requires attention, especially when analyzing volumes and candle closes.
In addition to breakouts, trendlines and channels help understand market volatility. A wide channel indicates strong swings, while a narrow channel suggests a consolidation phase. This reading is essential for adapting strategies: in wide channels it is possible to operate with more aggressive approaches, while in narrow channels it is often preferable to wait for a breakout.
In summary, trendlines and channels are not just lines drawn on the graph, but tools that tell the story of the market. They allow you to interpret the direction of prices, identify key moments and make decisions with greater confidence. With practice and precision, they become indispensable allies for those who want to improve their crypto trading.