Indicators & signals
Supports and Resistances
Support and resistance are among the most important concepts in technical analysis. They represent key price levels where the market tends to stop, reverse direction or accelerate movement. For those who trade…
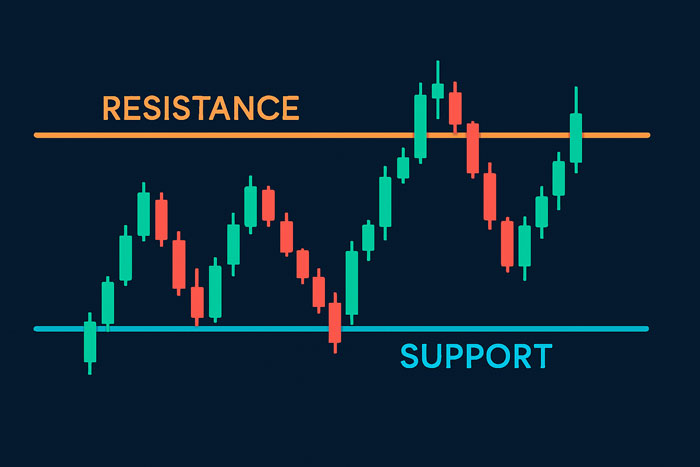
Support and resistance are among the most important concepts in technical analysis.
They represent key price levels where the market tends to stop, reverse direction or accelerate movement.
For those who trade, especially in the crypto market where volatility is high, understanding how these levels work means having a chart map before your eyes.
A support is an area in which the price, as it falls, finds "support": buyers become more aggressive and prevent further declines.
A resistance, on the contrary, is an area in which the price, as it rises, encounters a barrier: sellers take control and block the rise.
How support and resistance are formed
These levels are created over time at:
- Important highs and lows on the chart
- Consolidation zones where the price has lagged for a long time
- Psychological levels (e.g. 1,000, 10,000, 20,000)
- Areas where a lot of trading volumes have been concentrated in the past
The market "remembers" these zones: when the price returns to them, many traders react in a similar way to what happened in the past, generating new rebounds or breakouts.
Supports and resistances in bullish and bearish trends
In bullish trend
- The supports are often retested after increases: the price drops, touches the level and rebounds.
- The resistances represent subsequent steps: once broken upwards, they often transform into the new support (concept of role reversal).
In bearish trend
- The resistances are the levels from which the price tends to resume its descent.
- The supports are continually put to the test and, if broken, can trigger further declines.
Understanding what market phase you are in is essential to correctly interpret these levels.
Rebounds and breakouts: two key signals
When the price hits a support or resistance two things can happen:
- Rebound (rejection)
The price touches the level and goes back.- On a support → possible buy signal
- On a resistance → possible sell or profit taking signal
- Breakout
The price decisively breaks the level and continues in the same direction.- Breaking of resistance → confirmation of the strength of the bullish trend
- Breaking of support → confirmation of weakness and possible further decline
Often, after a breakout, the price returns to retest the level just broken (the so-called pullback), offering new operational opportunities.
How to draw support and resistance on the chart
To identify supports and resistances in a practical way:
- Use higher timeframes (daily, 4H) to mark key levels.
- Connect visible highs and lows where the price has reacted several times.
- Consider levels as zones and not as perfect lines: the market is dynamic.
- Check whether strong volumes have been concentrated on those points in the past.
The more times a level has functioned as support or resistance, the more significant it will be considered by traders.
Common mistakes to avoid
- Drawing too many levels, making the graph unreadable.
- Trust only support/resistance without looking at the general trend.
- Ignore news that can easily break even the most solid levels.
- Do not use stop-loss, thinking that support or resistance will always hold.
Supports and resistances are not indestructible walls, but probabilistic tools to be integrated into a complete trading strategy.
Conclusion
Supports and resistances are the basis for reading the market structure.
They help to understand where the price could stop, bounce or explode, offering more reasoned entry and exit points.
For the crypto trader they represent an essential visual reference, especially if combined with other tools such as trendlines, indicators and volumes.