Indicators & signals
What is a Technical Indicator: Introductory Guide
Technical indicators are fundamental tools for anyone who wants to analyze the cryptocurrency market professionally. Based on mathematical formulas applied to price movement, volume or other…
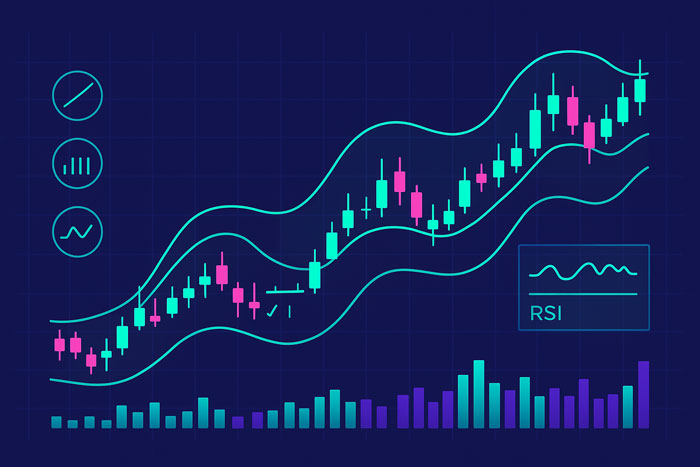
Technical indicators are essential tools for anyone who wants to analyze the cryptocurrency market professionally. Based on mathematical formulas applied to price movement, volume or other market data, they allow traders to identify trends, reversal points, overbought or oversold zones, as well as possible signals to enter or exit a position.
Unlike fundamental analysis, which studies the intrinsic value of an asset, technical analysis focuses exclusively on market behavior. Technical indicators therefore play the role of "filters" that help interpret price noise, making it easier to identify patterns and confirmations.
Why technical indicators are important in crypto trading
The crypto market is characterized by high volatility and often rapid movements. For this reason, indicators become precious tools for:
- Recognize the direction of the trend (bullish, bearish or lateral)
- Identify areas of potential entry or exit
- Evaluate the strength or weakness of the market
- Reduce risk through more objective signals
- Confirm decisions made using other analysis methods
Although they do not guarantee certain results, indicators help the trader make decisions based on data and probability, rather than emotions.
Main types of technical indicators
The technical indicators are not all the same: each category responds to a different need.
1. Trend indicators (Trend Following)
These indicators detect the dominant direction of the market.
Examples: Moving Averages (MA), MACD, Supertrend.
2. Momentum indicators
They measure the speed of price movements and signal overbought or oversold conditions.
Examples: RSI, Stochastics, ADX.
3. Volatility indicators
They show how quickly the price changes and help you understand how risky a particular move is.
Examples: Bollinger Bands, ATR.
4. Volume indicators
They analyze buying and selling pressure to understand the real strength behind a movement.
Examples: OBV, Volume Profile, VWAP.
How to correctly use a technical indicator
A common mistake made by beginners is using too many indicators at once, creating confusion and mixed signals. The general rule is:
- Choose a few but complementary indicators
- Do not use indicators that measure the same thing
- Combine trend, momentum and volume for more robust signals
- Use indicators as confirmation, not as the only strategy
Technical indicators work best when they are integrated into a coherent system, supported by effective risk management.
Conclusion
Technical indicators are an essential part of every crypto trader's arsenal. They don't predict the future, but they offer a clearer view of market movements, helping you spot opportunities and make more informed decisions. Understanding how they work is the first step to building a solid and sustainable trading strategy over time.