Technical analysis
How to Read a Crypto Chart: Basics and Essential Tools
Knowing how to read a crypto chart is one of the most important skills for any trader, beginner or advanced. The graphs are not simple visual representations of the price: they tell the story of the market, of the emotions…
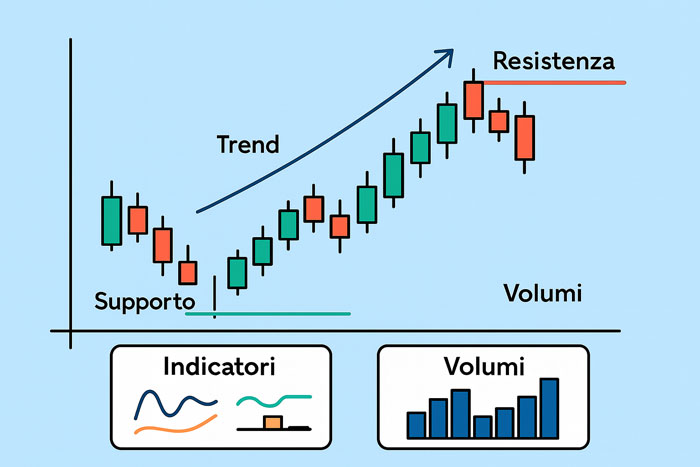
Knowing how to read a crypto chart is one of the most important skills for any trader, beginner or advanced. The graphs are not simple visual representations of the price: they tell the story of the market, of the traders' emotions, of the moments of panic and euphoria, of the accumulation and distribution phases. Understanding these signals allows you to make more informed decisions and identify opportunities that, on a superficial reading, would go unnoticed.
The first step is to know the most used types of charts. In crypto trading, the most popular is the Japanese candlestick chart, which allows you to observe the opening, closing, high and low of each period. Each candle represents a battle between buyers and sellers: a green body indicates dominance of buyers, while a red body reveals dominance of sellers. The shadows of the candles, however, communicate how much the price has fluctuated within the chosen timeframe.
Another fundamental element is the trend, or the predominant direction of the market. An uptrend shows increasing highs and lows, while a downtrend shows them decreasing. Recognizing the main trend helps you operate in its direction, one of the most important rules of trading: "The trend is your friend". Additionally, observing changes in the pace of the trend can help spot possible reversals.
Alongside the trend, it is essential to identify support and resistance, i.e. price levels where the market tends to rebound or reverse. Supports represent areas of strong demand, while resistances indicate areas where supply dominates. These levels not only help predict potential future movements, but are also strategic points for placing entries, stop losses and take profits.
To make the analysis even more accurate, various technical indicators are used. Among the most common we find moving averages, which help visualize the general direction of the market by smoothing out the noise of daily movements. The RSI measures the strength of the momentum, signaling overbought or oversold areas, while the MACD highlights accelerations and slowdowns of the trend. Each indicator adds a piece to the understanding of the chart, but it is important to use them in moderation to avoid visual overload.
Finally, reading a chart also means looking at volume, a key indicator that reveals market participation. A price movement accompanied by high volumes is generally more reliable than one with low volumes. The volume confirms the strength of trends, breakouts and chart patterns.
Learning to read a crypto chart requires practice and consistency, but it is a skill that pays off over time. Knowing the essential elements allows you to better interpret the market, anticipate scenarios and build more solid and aware strategies.